> ## Documentation Index
> Fetch the complete documentation index at: https://agenticbanking.backbase.io/llms.txt
> Use this file to discover all available pages before exploring further.
# Connector health and metrics
> Investigate the health and metrics of a single connector in the Banking OS Console.
When a connector needs attention, open its detail view to see how it's behaving over time. The metrics help you confirm whether a connector has recovered or narrow down where an issue started.
## Open a connector
To reach a connector's metrics, start from the dashboard:
On the dashboard, select the pack that contains the connector you want to review.
In the pack details view, select the connector. The console opens the connector's health and metrics.
## Understand the health status
Each connector carries one of three health statuses. The following table describes what each status means and the typical next step.
| Status | Meaning | Suggested action |
| :- | :- | :- |
| **Healthy** | The connector is running normally. | No action needed. |
| **Needs attention** | The connector shows warnings. | Review the metrics for unusual patterns. |
| **Urgent** | The connector has a serious problem. | Investigate right away and contact Banking OS support if needed. |
## Read the metrics
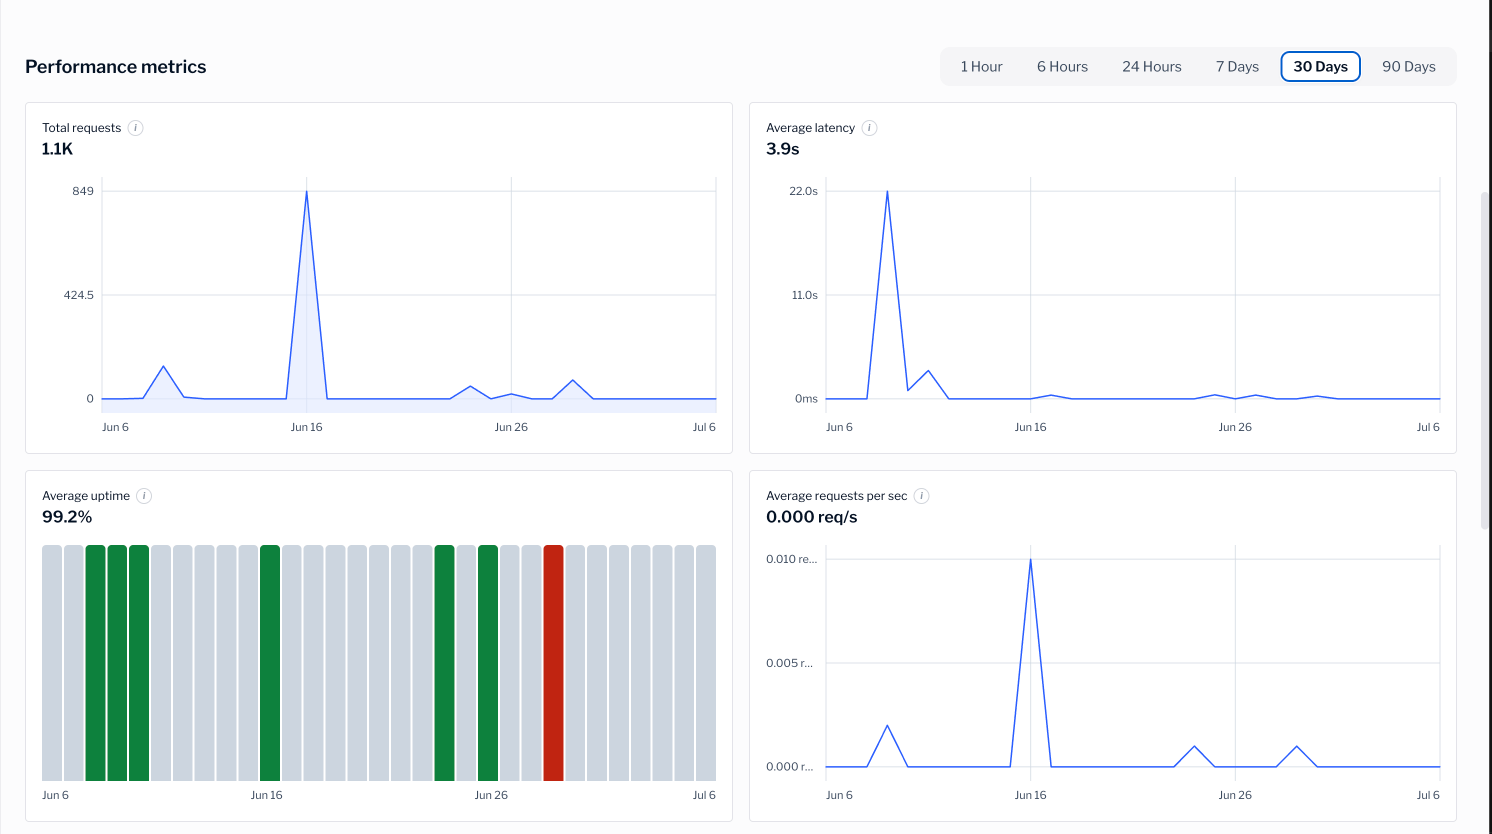
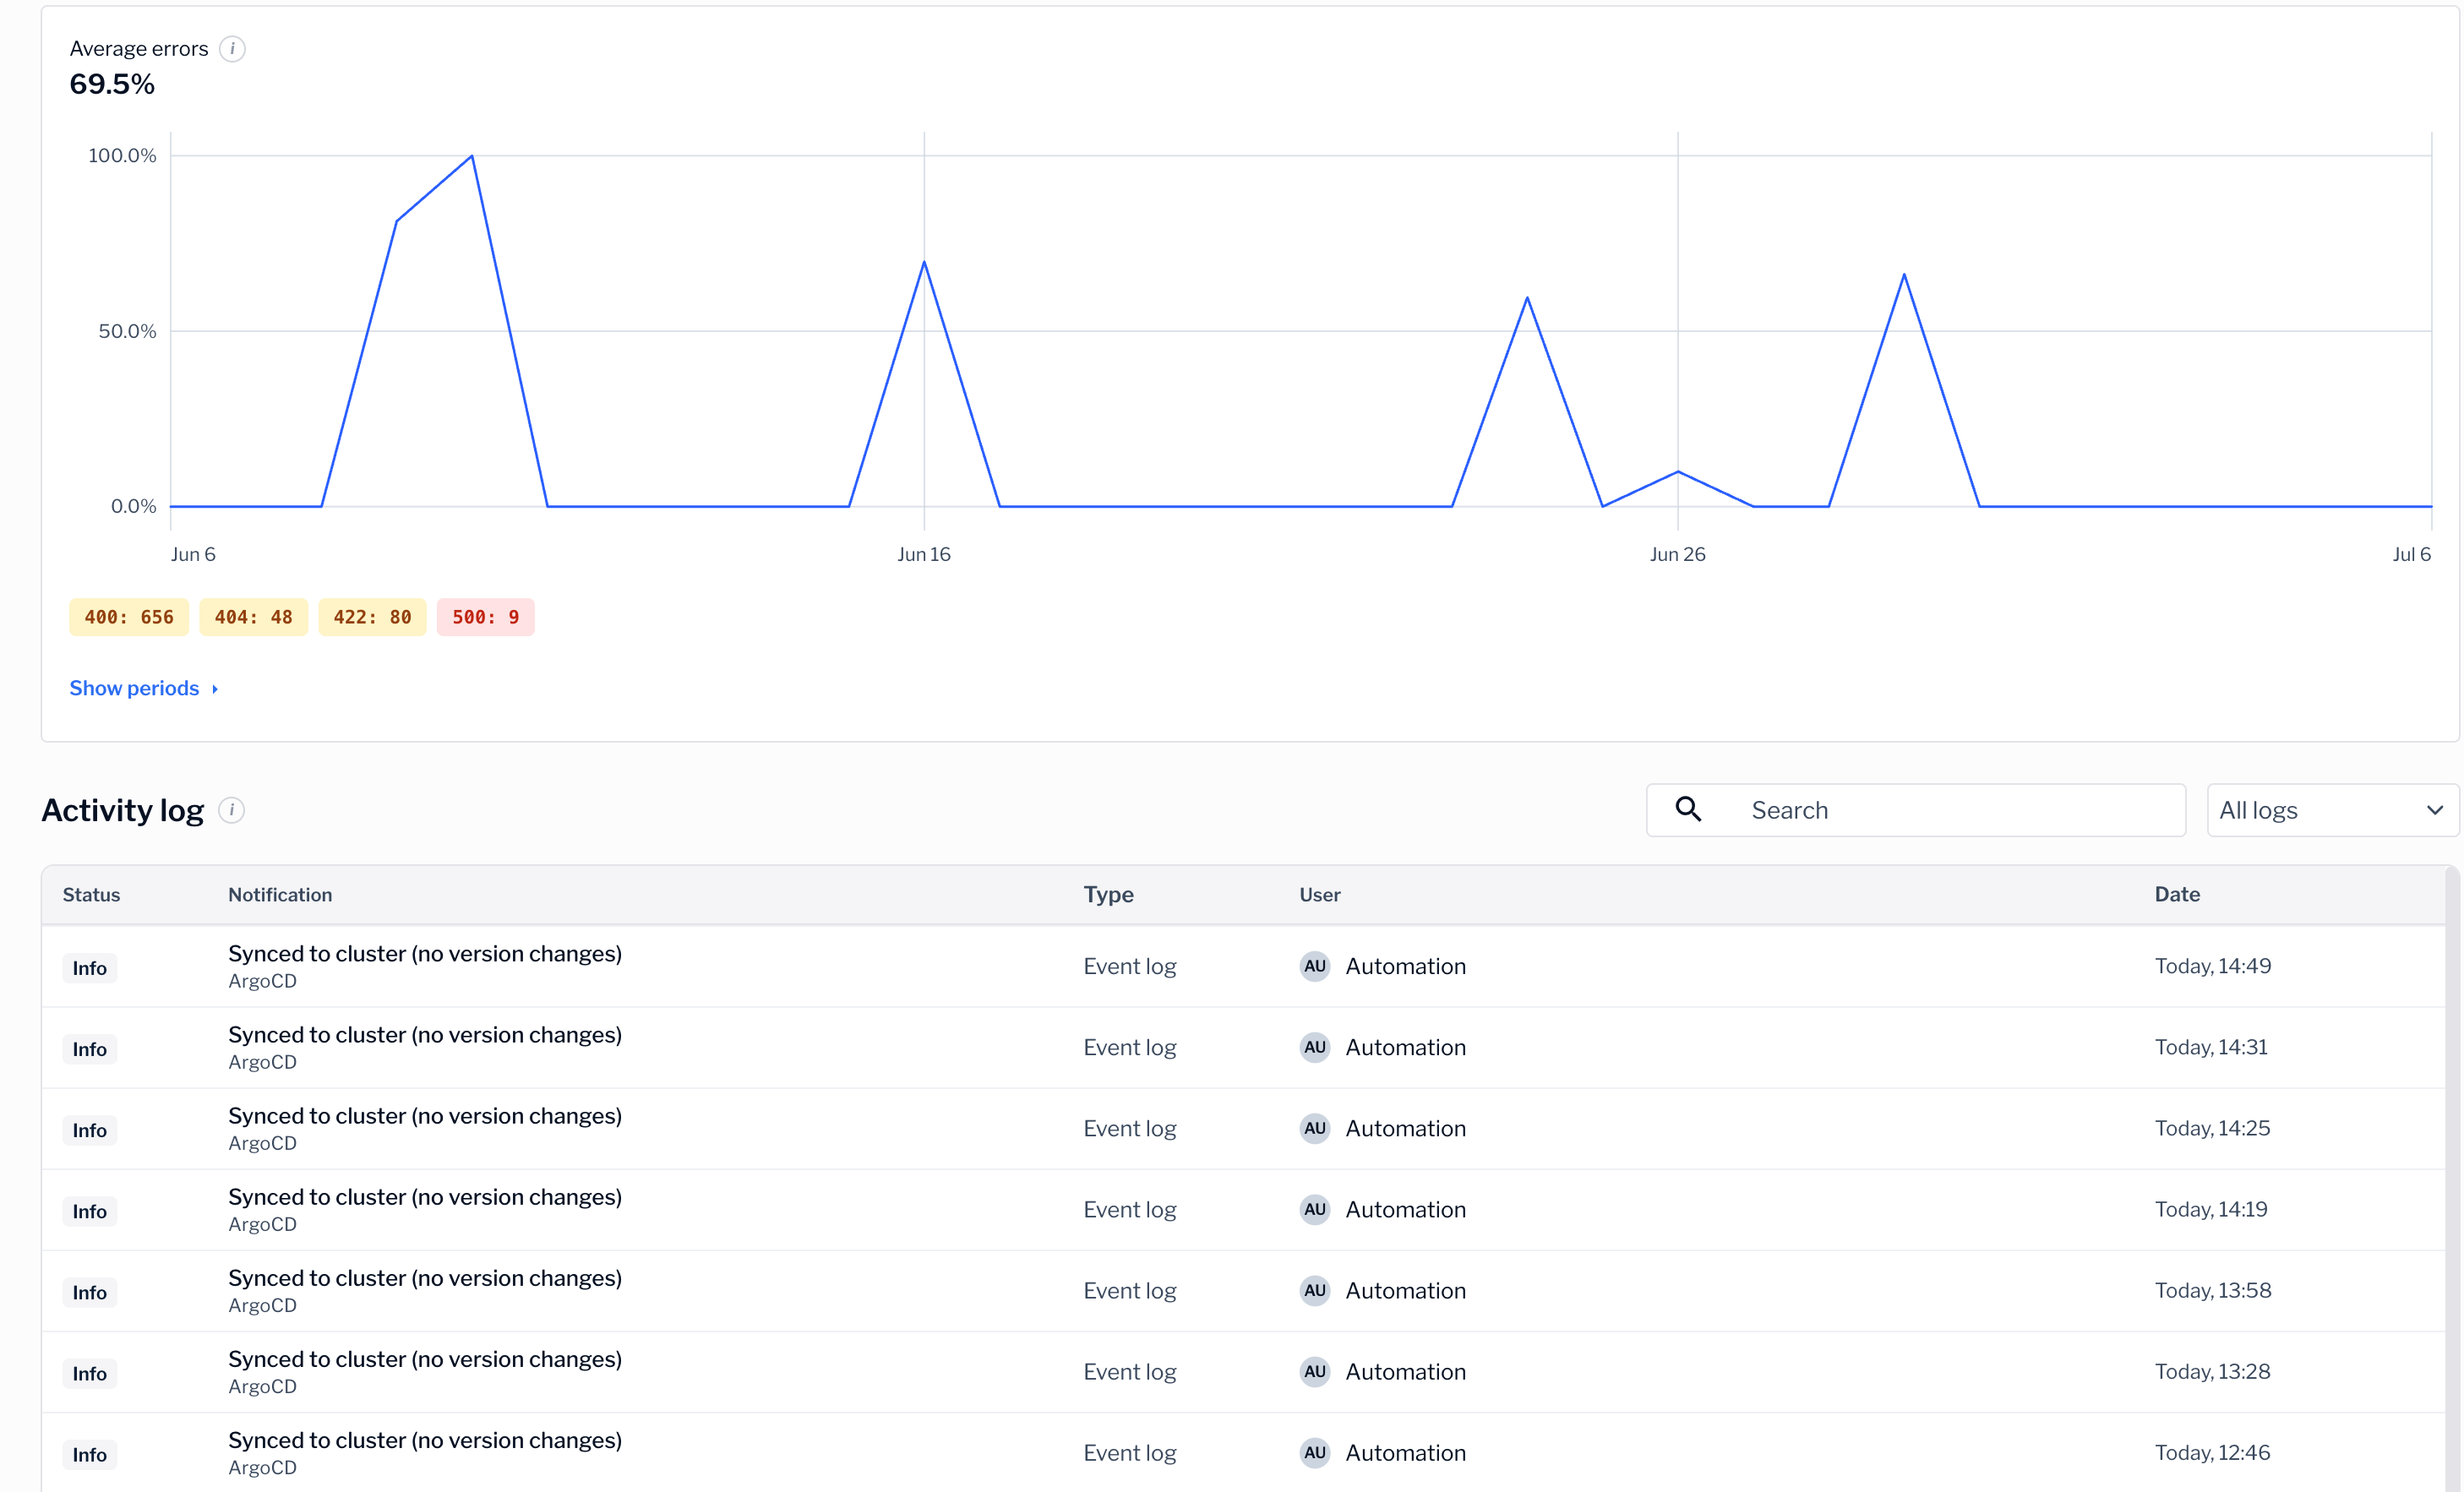
The connector view shows metrics over a time range, such as request volume and error rates. Use the metrics to answer questions like these:
* Did errors start at a specific time?
* Is traffic higher or lower than usual?
* Has the connector recovered after a change?
Metrics reflect the runtime you selected when you signed in. To review a different environment, switch runtimes and open the connector again. For more information, see [Sign in and select a runtime](/banking-os-app/sign-in).
## When to escalate
If a connector stays **Urgent** or its errors keep climbing, contact Banking OS support. Share the connector name, the runtime, and the time range where you first saw the problem, so the team can investigate faster.
## Next steps
Return to the dashboard to review the rest of your connectors.